POLYMATICA HAS RELEASED A DESIGNER FOR SELF-CREATION OF DASHBOARDS
A new dashboard designer, like the rest of the vendor’s products, adopts a self-service concept. With its help, a user with any level of analytical skills can create a dashboard in minutes and share with colleagues. Together with the Polymatica Analytics it provides full data driven solution making from KPIs to detailing into the initial data for a detailed study of the situation.
Polymatica specializes in developing tools for analyzing large amounts of data (billions of rows). Its flagship product, the Polymatica Analytics platform, features fast processing speed for unlimited data sets and a user-friendly interface that allows users to get analytic cuts without the involvement of IT specialists. The platform is used by public sector, as well as telecom, retail, banking and energy sectors.
To provide users with more opportunities for independent work with their data, Polymatica has developed a product – a dashboard designer where any employee can independently create the widgets he needs and build an interactive dashboard on their basis. A laconic and intuitive interface allows you to master Polymatica Dashboards in a couple of hours.
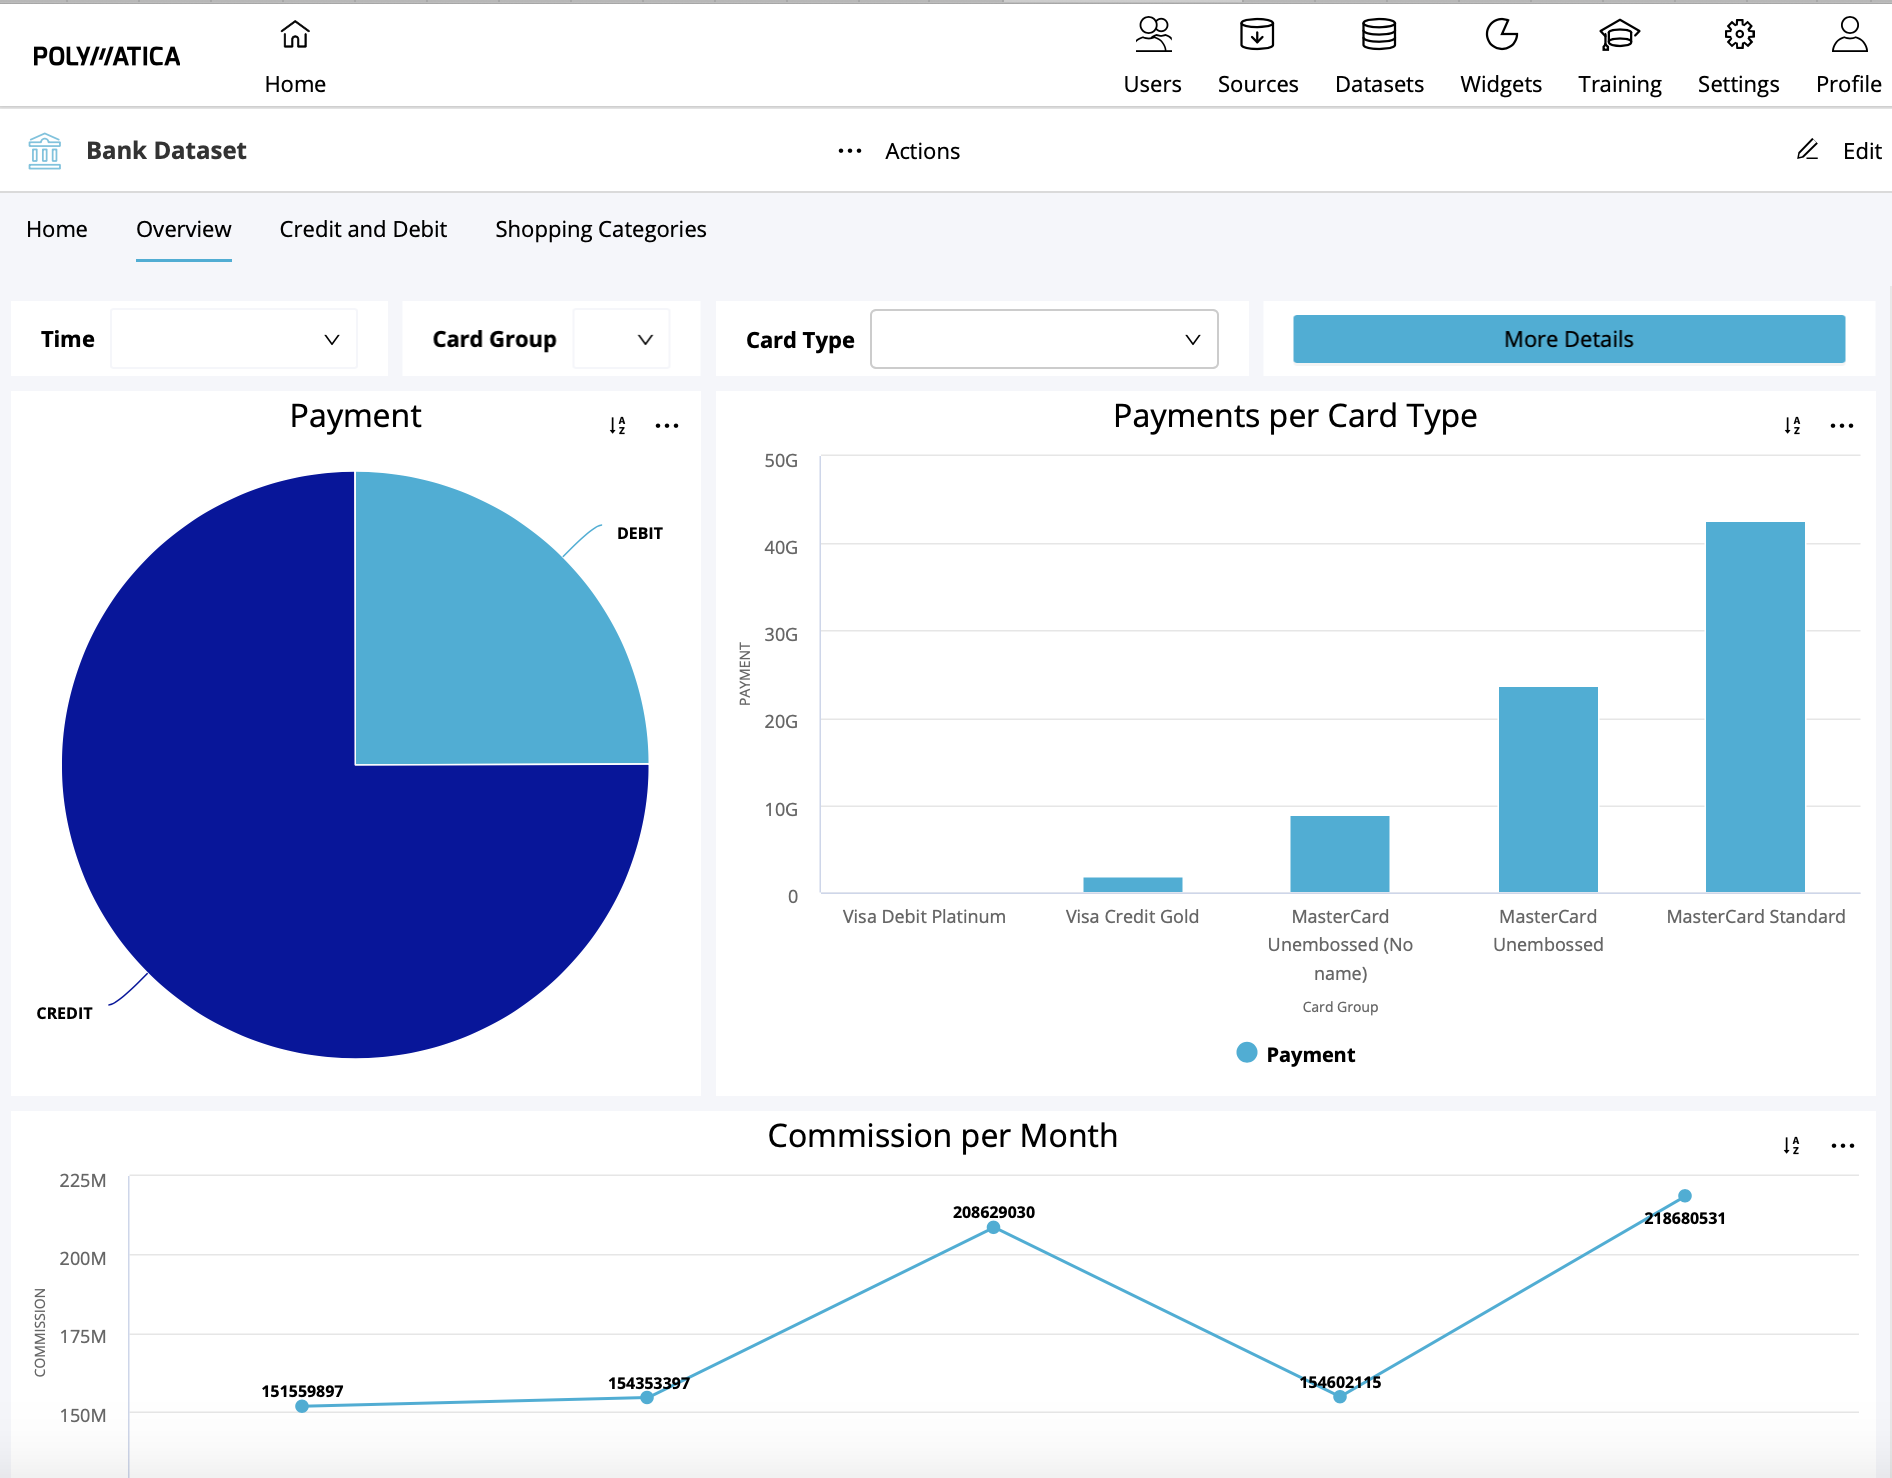
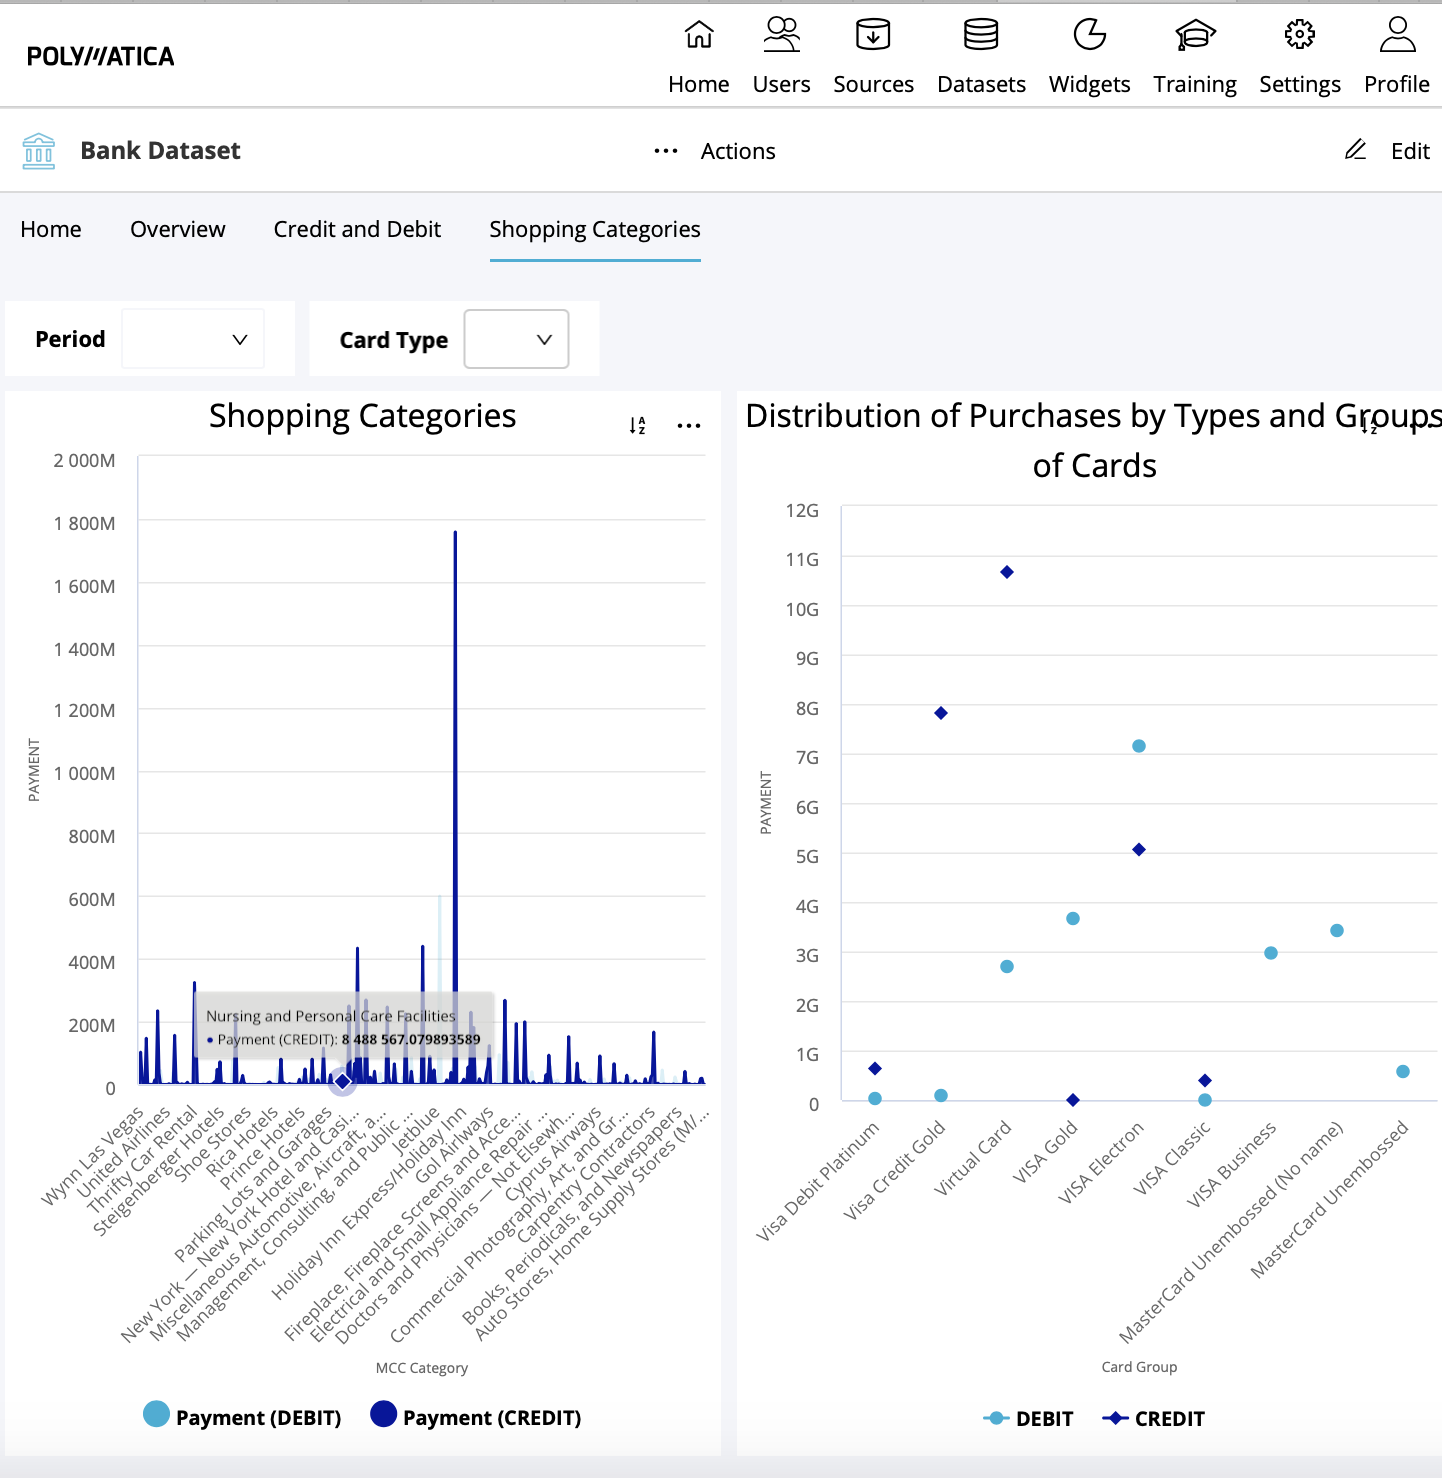
The solution allows you to present the results of data analysis in the most convenient and visual form. The panel can be quickly rebuilt using various filters: this is especially convenient if, for example, a business user needs to get more detailed information on one of the indicators. The dashboard can be exported to a PDF or PNG file, a link on the company’s website, or share a link to it with managers and colleagues.
With an integrated implementation of Polymatica Analytics and Polymatica Dashboards, company employees can make an instant transition from aggregated indicators to the level of initial detail for detailed research. If, when working with an interactive report, an analyst or manager becomes interested in certain numbers, they can drill down from the dashboard into the analytical module and see how these values were formed and what factors influenced them.
“Speed of acceptance of management decisions considerably increased, and for bigger efficiency they should be based on qualitative data. Therefore evident analytical reports with useful insights are necessary to heads of all levels literally in real time. Often in the large companies demand for them is so high that IT specialists can not always quickly process all requests and satisfy them in time. It influences market development of BI, and we see how the efficiency and availability of tools become the main trends. Our designer completely corresponds to them: users can work with any level of IT skills. We also took care of fault tolerance: the solution does not lose in speed even at ten thousand of connections therefore each user can watch dynamics of business processes in real time”, – Sergey Kulikovskiy, the CEO at Polymatica commented.
About Polymatica
We are a BI software company with a difference. We pioneer new and accessible ways for global businesses to understand and use their data.
The Polymatica BI platform uses embedded intelligence to deliver results and insights, at incredible scale and speed, thanks to a revolutionary GPU and CPU hybrid architecture.
Focused on business users throughout an organisation, we offer intuitive data analysis software, assisted decision-making solutions and visual storytelling tools, as well as consulting services and training designed to build the expertise of our clients.