We help to validate either action or no action.
You can create interactive dashboards for analysis and for management within minutes.
We help to validate either action or no action.
You can create interactive dashboards for analysis and for management within minutes.
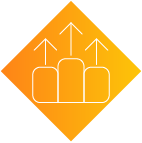
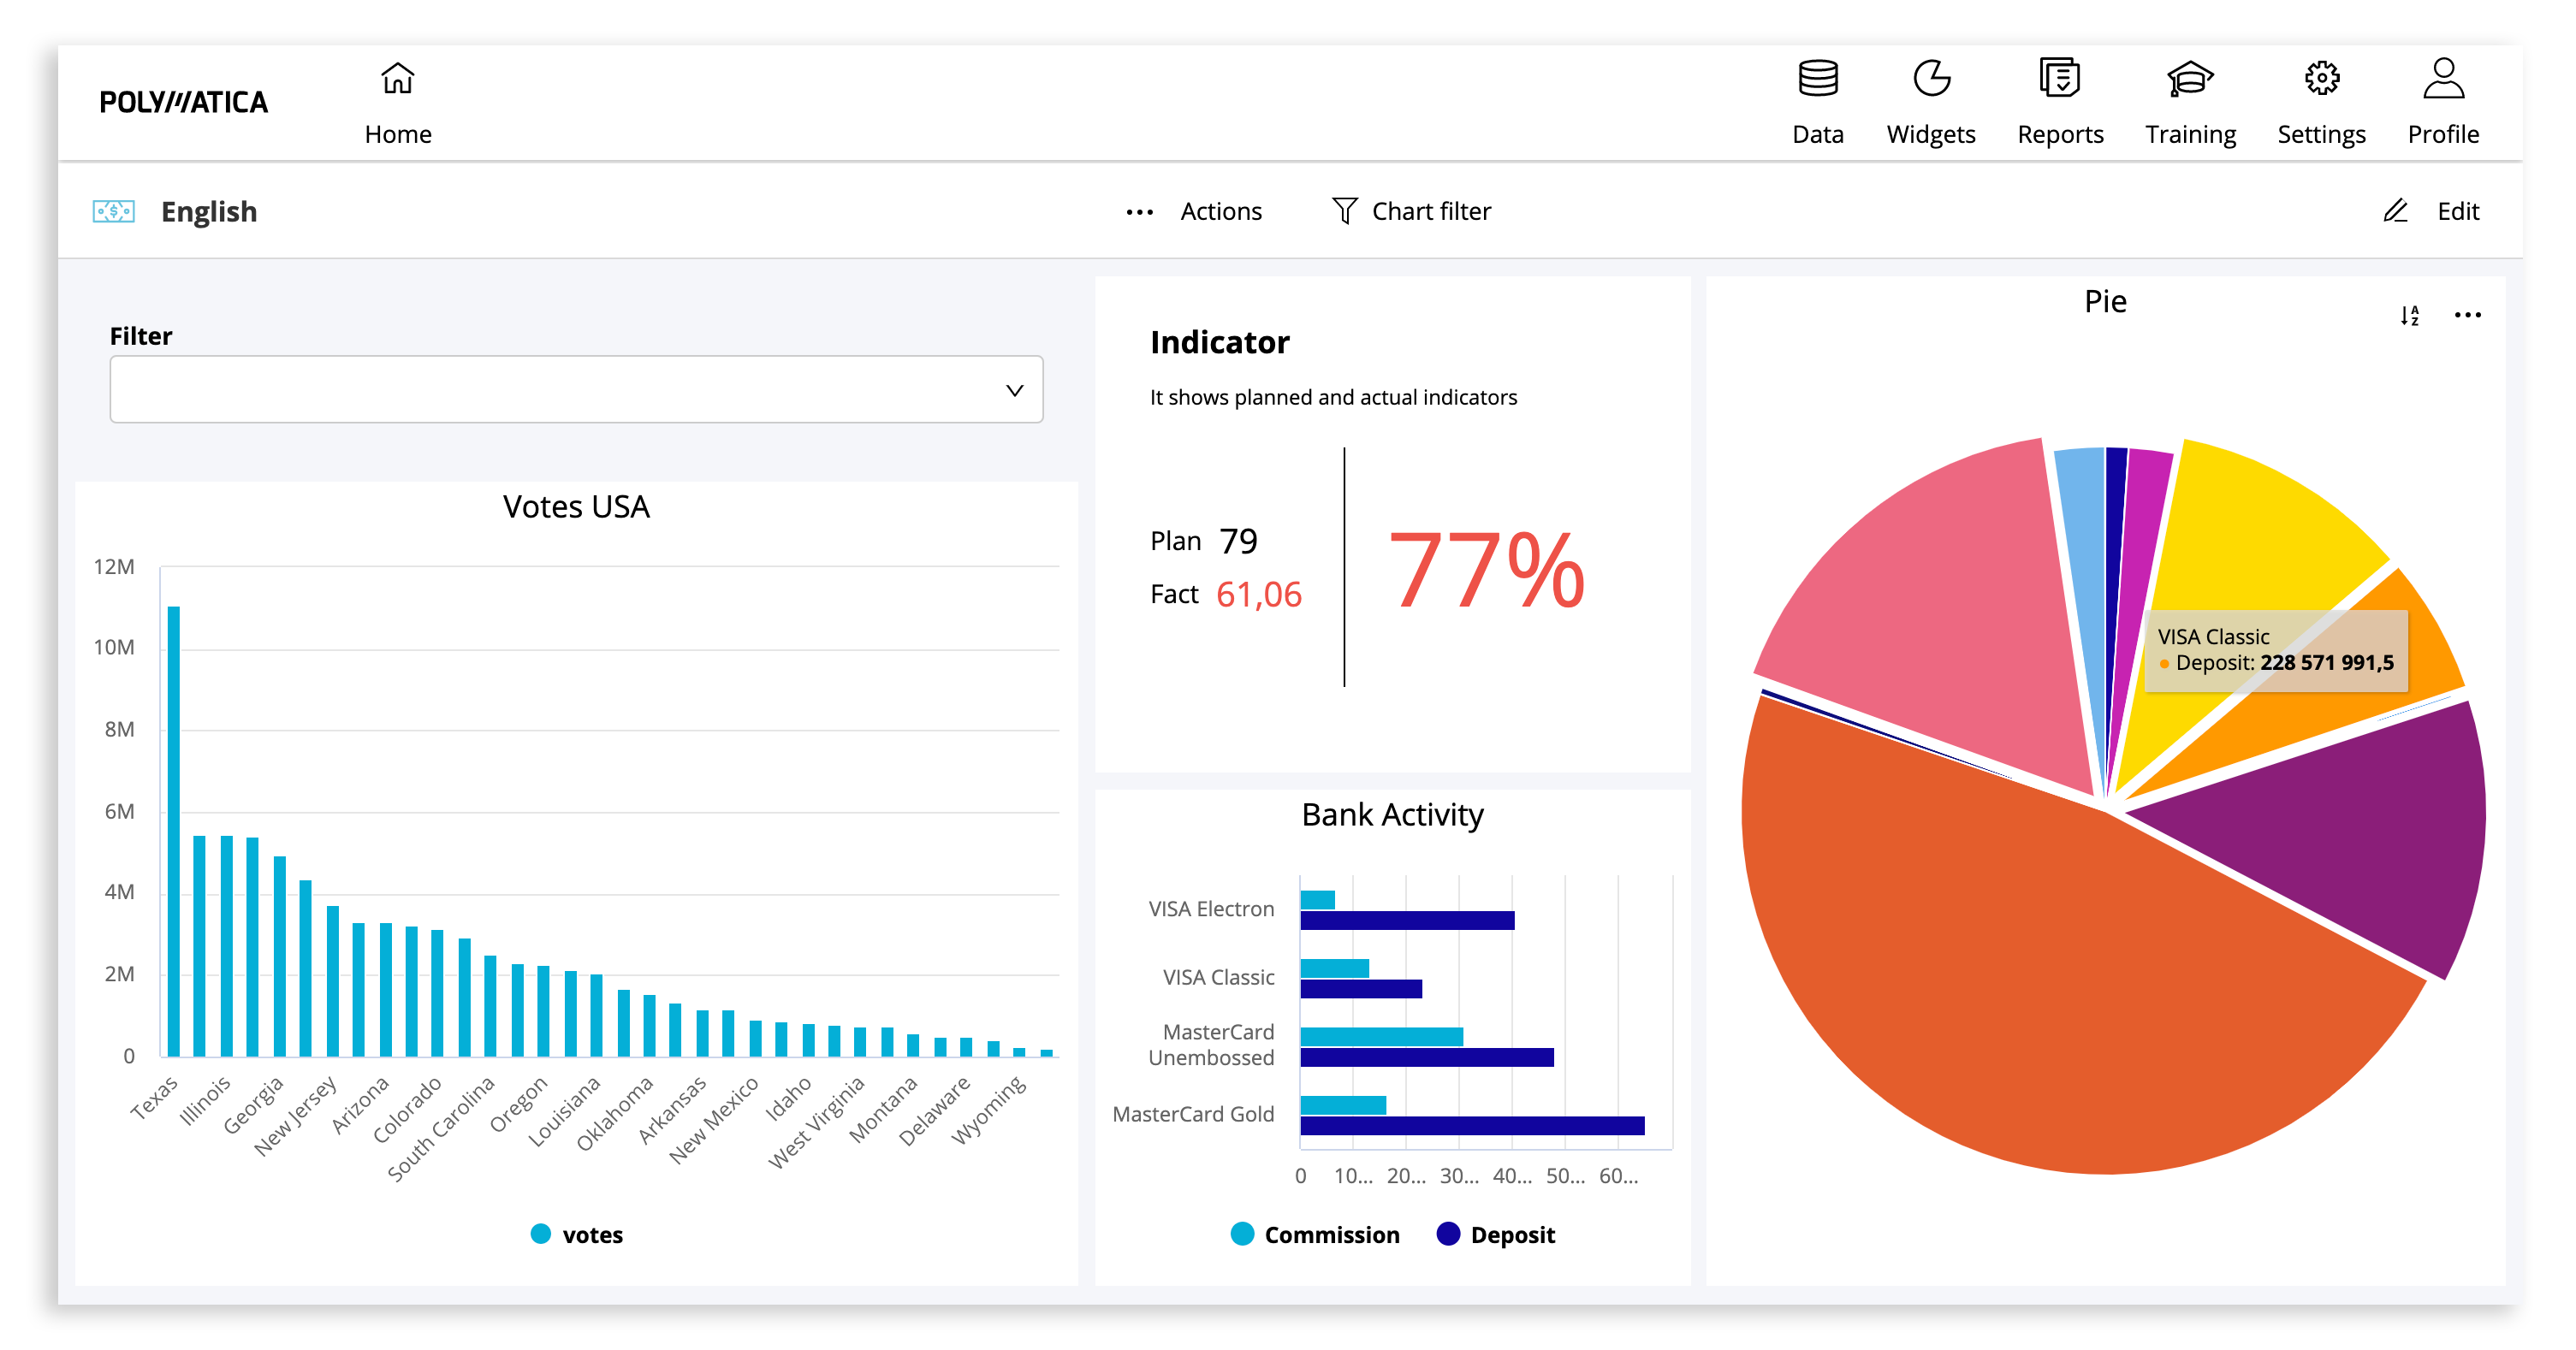
This is an intuitive instrument for creating interactive dashboards without needing any knowledge of programming. Polymatica Dashboards can be used on its own or together with Polymatica Analytics for a detailed understanding of the situation based on the entire dataset.
Better
You can become expert champions with Polymatica Dashboards. High performance is based on many factors that need control. We provide an easy to use panel with indicators, where you can see all the components needed for success and not just the desired result.

Faster
The speed of decision-making is influenced both by the frequency of data updates on dashboards and also by the complexity of the path from the success factors to the result. Thanks to the simplicity of Polymatica instruments and our proprietary data processing technology, you are able to turn the marathon into a sprint.

Stronger
The value extracted from your data becomes your competitive advantage. You can use it to take the lead in your market.

Large selection of widgets: graphics, text, pictures, tables

Filters for a dashboard and a separate chart

Indicators

Access Control System
A simple mechanism for creating widgets and viewing panels
Easy data import from different sources

You can share the link and embed it in the portal.

Options for Export to PDF and PNG

Choosing your color scheme
The beauty of the Polymatica platform is that it has been designed with true accessibility in mind – making the power of data science available to everyone, regardless of job role or background.
With our platform, everyone can use data to their advantage.
Polymatica Dashboards allow you to configure access to sources, datasets, widgets, and dashboards for users or groups of system users. A ready-made dashboard can be opened or closed for viewing by individual Internet users.
Roles in the system:
Data import for the dashboard from various sources:
The functions of server connection and dataset loading are separated to reduce the workload on your infrastructure.
All your datasets are stored in the system and updated following your requirements.
Interaction with Polymatica Analytics is carried out through scripts recorded in the analytic platform.
To get detailed information on the indicators presented, use the analytical module Polymatica Analytics. This gives access to all the functionality of the analytical module enabling users to find reasons for changes in their indicators and to conduct additional research at the initial data level.
Discover how Polymatica helped Rostelecom’s socially important project improve the quality of its services.
© Polymatica Rus Ltd 2011-2024